
Memory Graphs
Capturing Program States
Universität des Saarlandes – Informatik
Informatik Campus des Saarlandes
Campus E9 1 (CISPA)
66123 Saarbrücken
E-mail: zeller @ cs.uni-saarland.de
Telefon: +49 681 302-70970


What's New
- The AskIgor automated debugging service uses memory graphs to isolate cause-effect chains from computer programs. This work won the ACM SIGSOFT Distinguished Paper Award.
- More papers on memory graphs are available.
- Upon popular request, details of the extraction process are now available.
About Memory Graphs
|
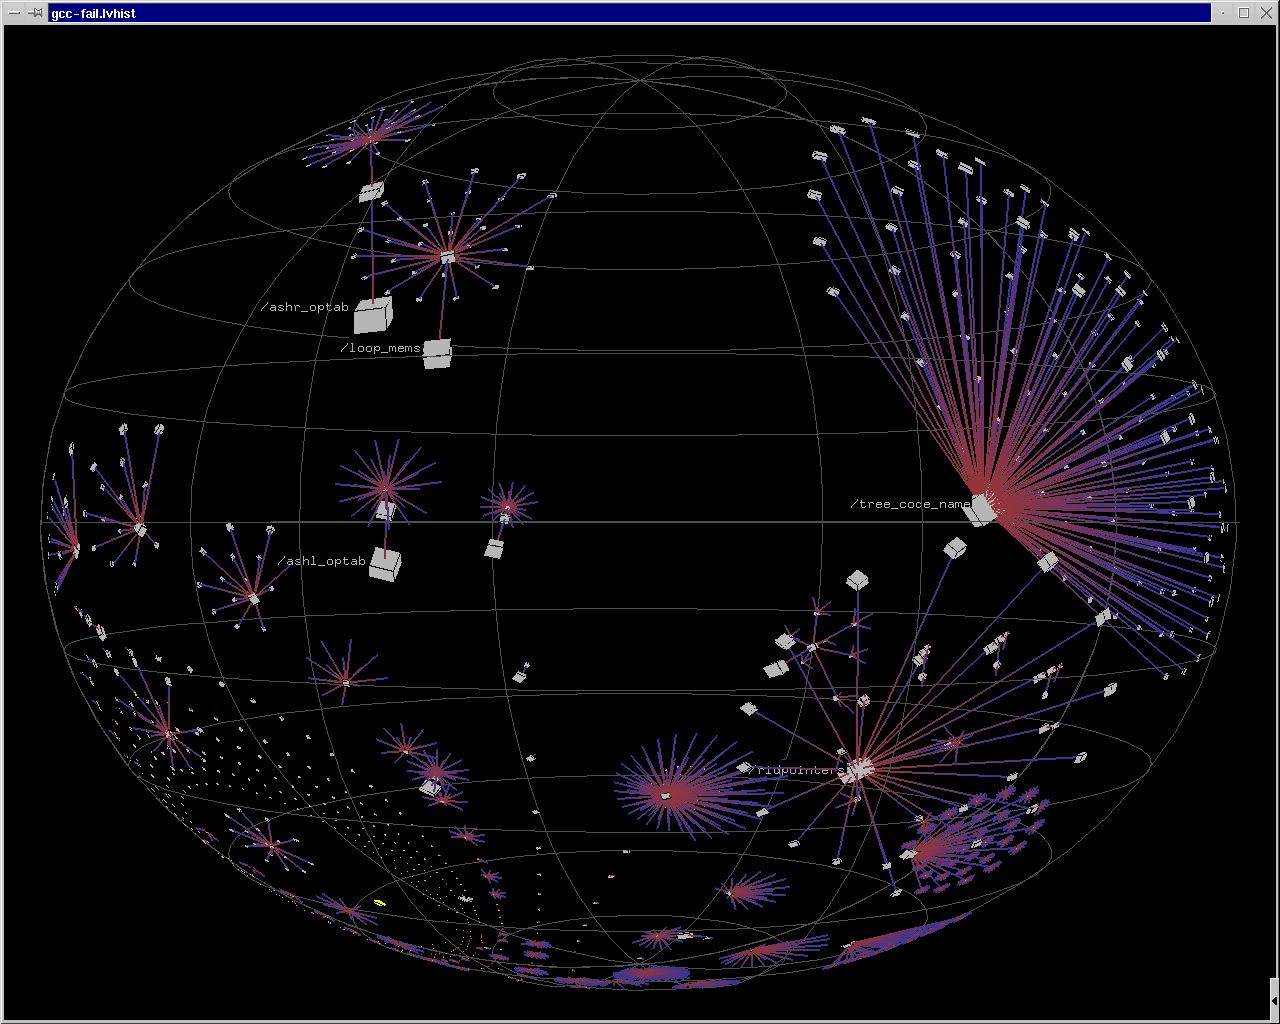
| GCC memory graph (screen shot) |
- Did you ever want to know what your program data looks like? Memory graphs represent the memory of a program. They consist of vertices for the memory content and edges for the possible access paths.
- Memory Graphs are captured automatically by unfolding all accessible data structures in the program. All common data structures like structs, unions, arrays or pointers are properly represented.
Applications
- What does one do with memory graphs? Our most important application is to detect common subgraphs to isolate differences between program states - especially differences that cause a failure. This is used to isolate cause-effect chains in computer programs.
- The next thing is to visualize data structures in memory automatically - in the style of DDD, but capturing the entire program state. The amount of data makes this a challenge for graph drawing and graph layout.
- Since we're working on graphs, another idea is to apply graph algorithms - to detect specific trouble spots or invariant violations.
- Right now, all this is work in progress. Bookmark this page for recent information and contact us if you want to contribute.
Papers
-
Visualizing Memory Graphs.
T. Zimmermann, A. Zeller; Proc. of the
Dagstuhl Seminar 01211 "Software
Visualization", Dagstuhl, Germany, May 2001. Lecture Notes in
Computer Science (LNCS) 2269, Springer-Verlag, pp. 191--204.
Abstract. To understand the dynamics of a running program, it is often useful to examine its state at specific moments during its execution. We present memory graphs as a means to capture and explore program states. A memory graph gives a comprehensive view of all data structures of a program; data items are related by operations like dereferencing, indexing or member access. Although memory graphs are typically too large to be visualized as a whole, one can easily focus on specific aspects using well-known graph operations. For instance, a greatest common subgraph visualizes commonalities and differences between program states. - Isolating Cause-Effect
Chains from Computer Programs. Andreas Zeller;
Proc. ACM SIGSOFT 10th International
Symposium on the Foundations of Software Engineering (FSE-10),
Charleston, South Carolina, November 2002.
Abstract. Consider the execution of a failing program as a sequence of program states. Each state induces the following state, up to the failure. Which variables and values of a program state are relevant for the failure? We show how the Delta Debugging algorithm isolates the relevant variables and values by systematically narrowing the state difference between a passing run and a failing run - by assessing the outcome of altered executions to determine wether a change in the program state makes a difference in the test outcome. Applying Delta Debugging to multiple states of the program automatically reveals the cause-effect chain of the failure - that is, the variables and values that caused the failure.
In a case study, our prototype implementation successfully narrowed down the cause-effect chain for a failure of the GNU C compiler: ``Initially, the C program to be compiled contained an addition of 1.0; this caused an addition operator in the intermediate RTL representation; this caused a cycle in the RTL tree - and this caused the compiler to crash.''
Examples
All example graphs are available in multiple file formats:- dot
- Graph layout file for the Graphviz graph drawing package.
- eps
- Encapsulated PostScript. Generated with the dot graph layouter (from the Graphviz package). You need a PostScript viewer such as Ghostscript to view these files.
- jpeg, png
- Bitmap image formats. Generated from eps files.
The graphs include the following information:
- Standard
- All variables of the program itself.
- with runtime library
- Same, but including memory of the runtime library. These graphs are huge.
- without merging
- Same, but without merging of arrays or struct members to single vertices. These graphs are even larger.
Userinfo
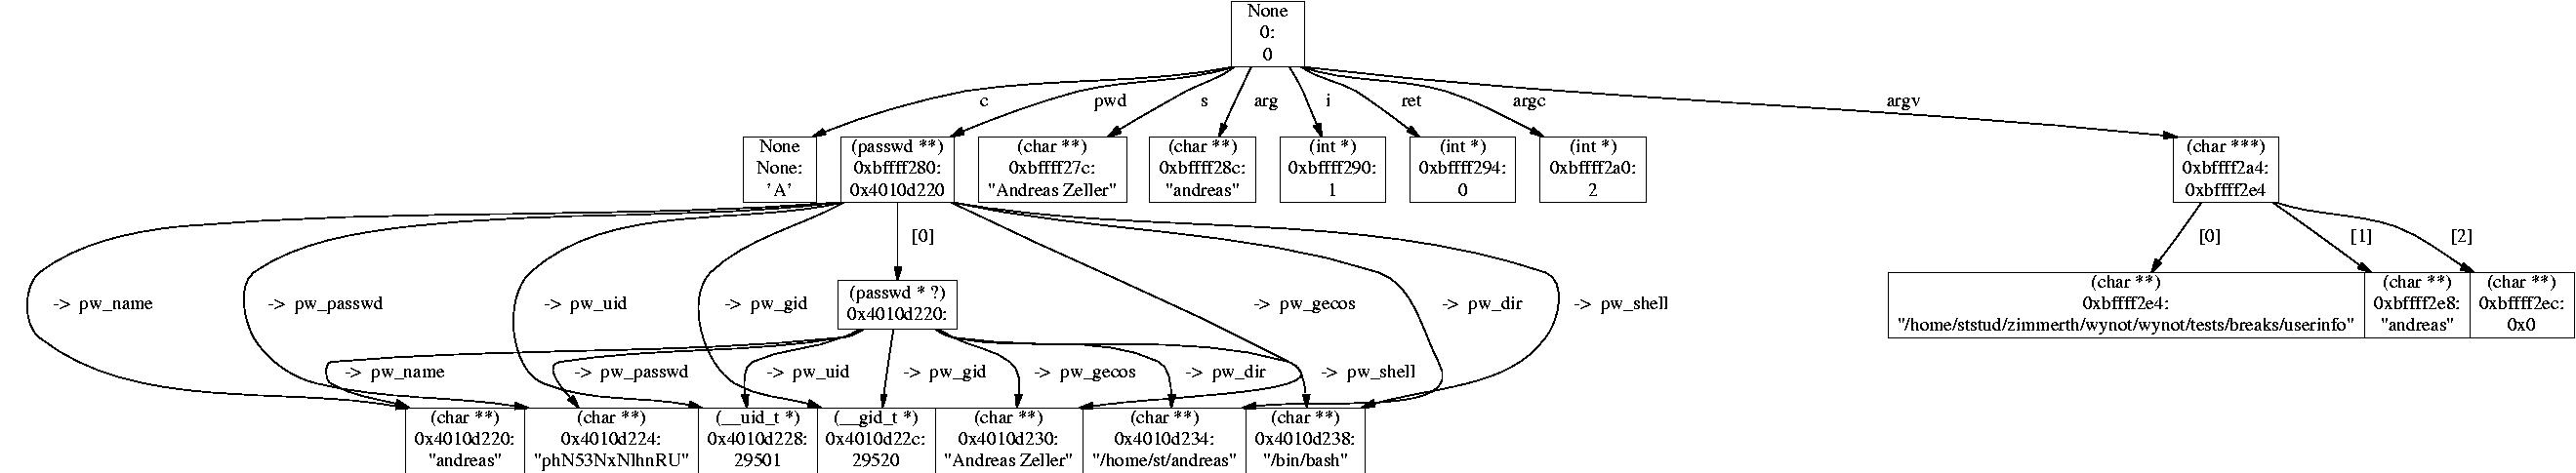
|
| Userinfo memory graph (excerpt) |
The memory graph was captured before the call of is_letter.
| Graph | Vertices | Edges | Download |
|---|---|---|---|
| Standard | 12 | 26 | dot · eps · jpeg · png |
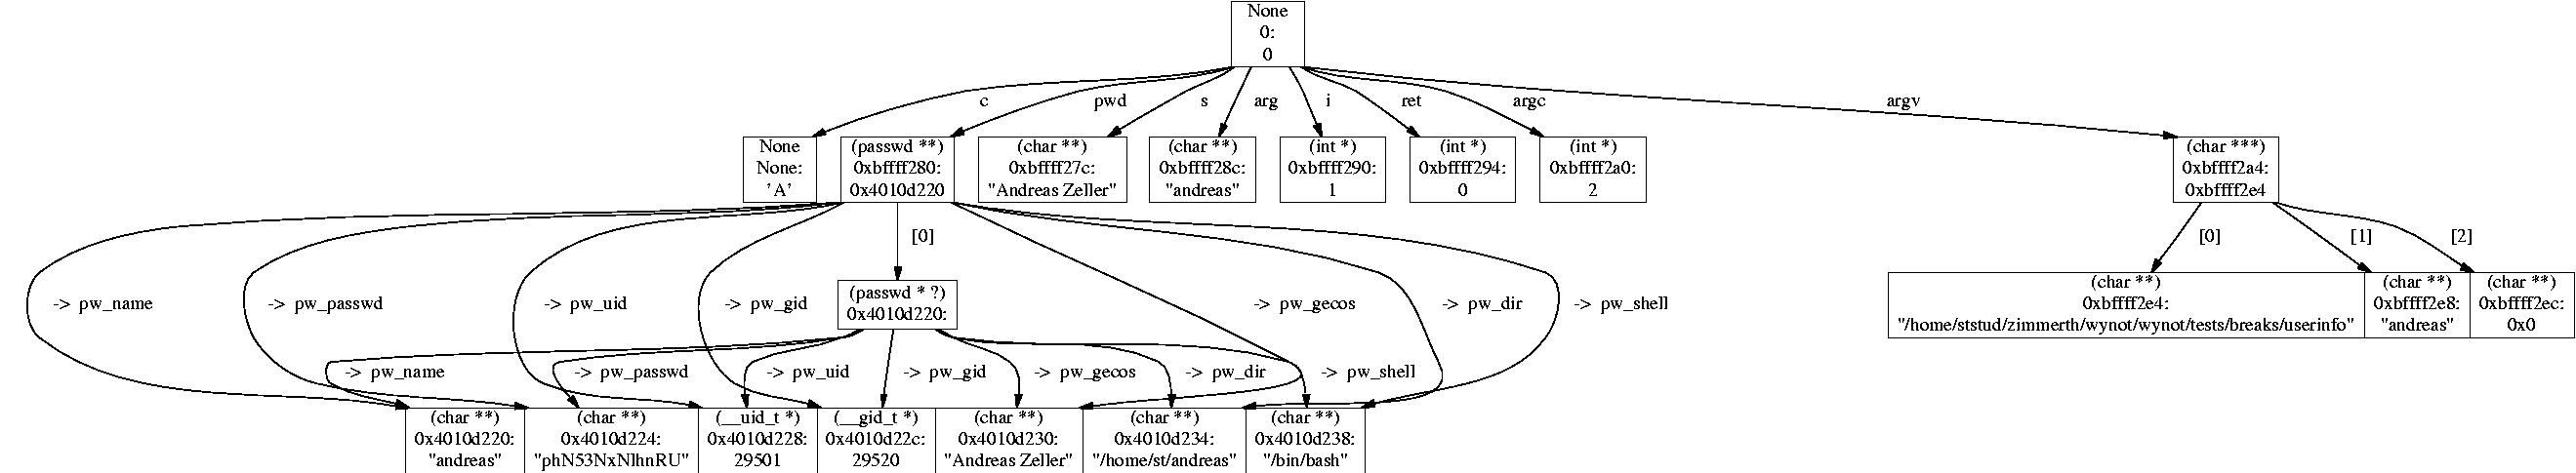
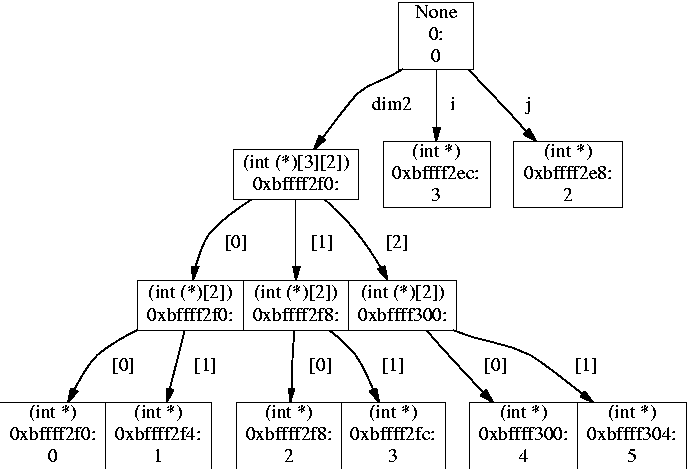
Structtest
A simple test program to show how unions and structs are unfolded. [Source: structtest.c]The memory graph was captured before the call of _break.
| Graph | Vertices | Edges | Download |
|---|---|---|---|
| Standard | 12 | 21 | dot · eps · jpeg · png |
| with runtime library | 1181 | 7318 | dot · eps |
| without merging | 4052 | 7318 | dot · eps |
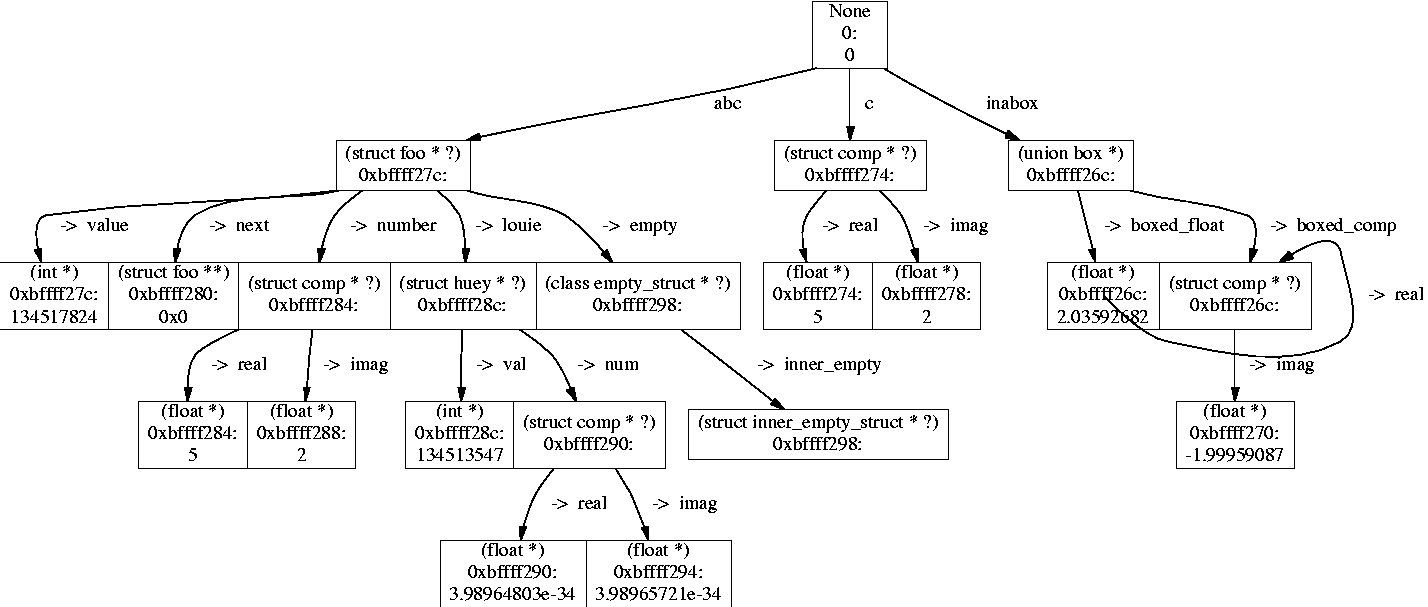
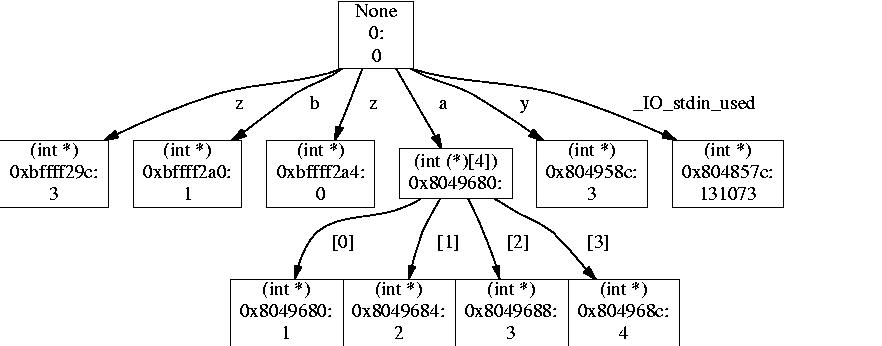
Arrtest

|
| Arrtest memory graph with runtime library (excerpt) |
The memory graph was captured before the call of _break.
| Graph | Vertices | Edges | Download |
|---|---|---|---|
| Standard | 8 | 12 | dot · eps · jpeg · png |
| with runtime library | 1177 | 7309 | dot · eps |
| without merging | 4044 | 7309 | dot · eps |
Schnitzl
Another small test program. [Source: schnitzl.c]The memory graph was captured before the call of function2.
| Graph | Vertices | Edges | Download |
|---|---|---|---|
| Standard | 8 | 10 | dot · eps · jpeg · png |
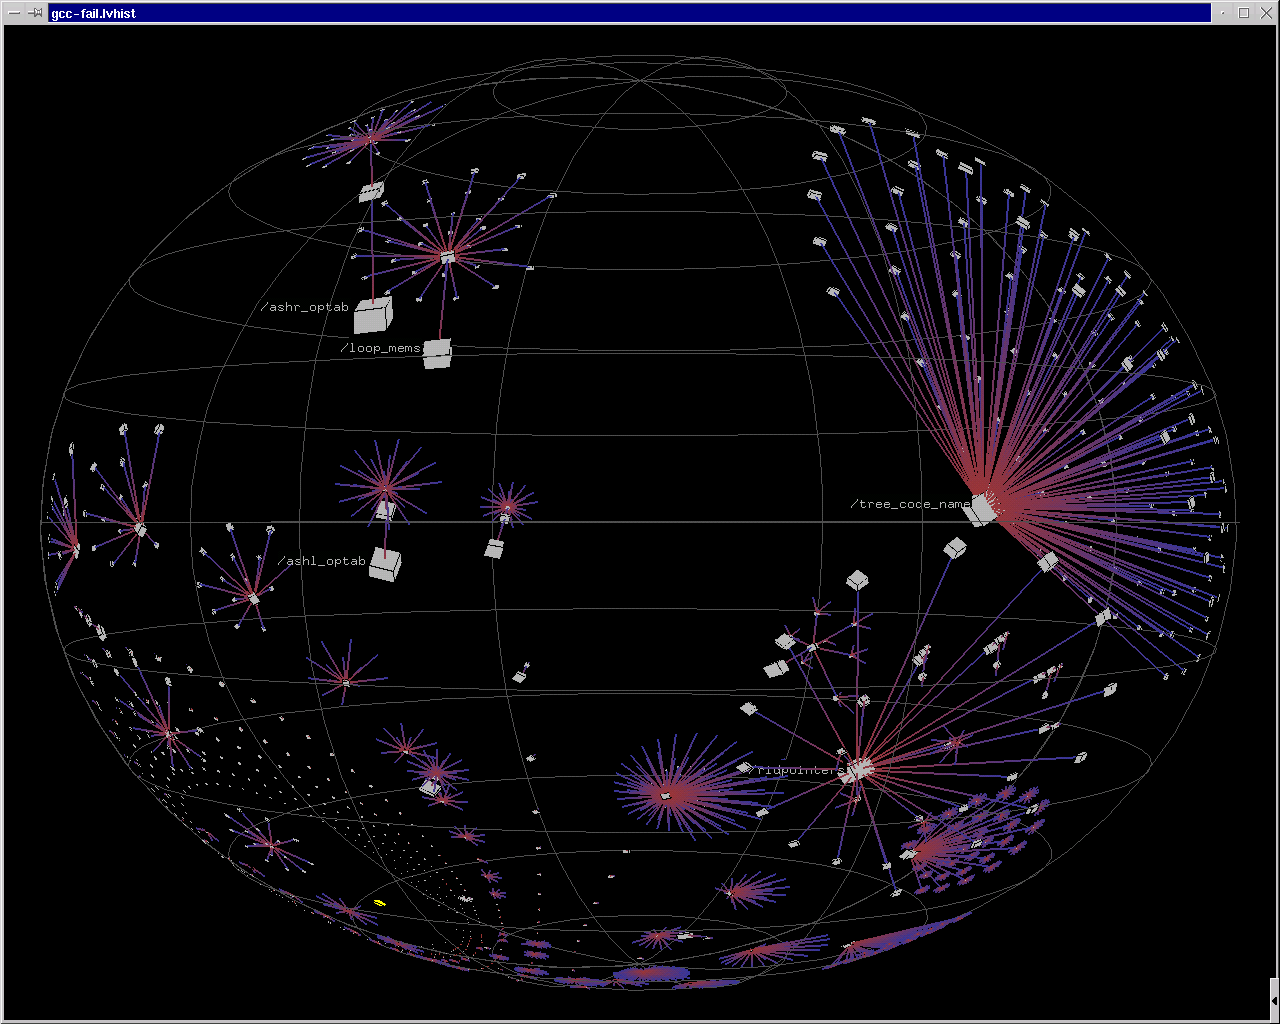
GCC
A large memory graph, depicting the state of GCC 2.95.2.The memory graph was captured before the call of combine_instructions. The dot layouter can not handle graphs of this size; instead, we used Tamara Munzner's h3viewer to generate these visualizations.
Actually, this graph represents an infected (faulty) program state: One single pointer points to the wrong element, causing GCC to crash. Read the whole story here.
| Graph | Vertices | Edges | Download |
|---|---|---|---|
| Standard | 71991 | 81646 | dot · eps · jpeg · png |
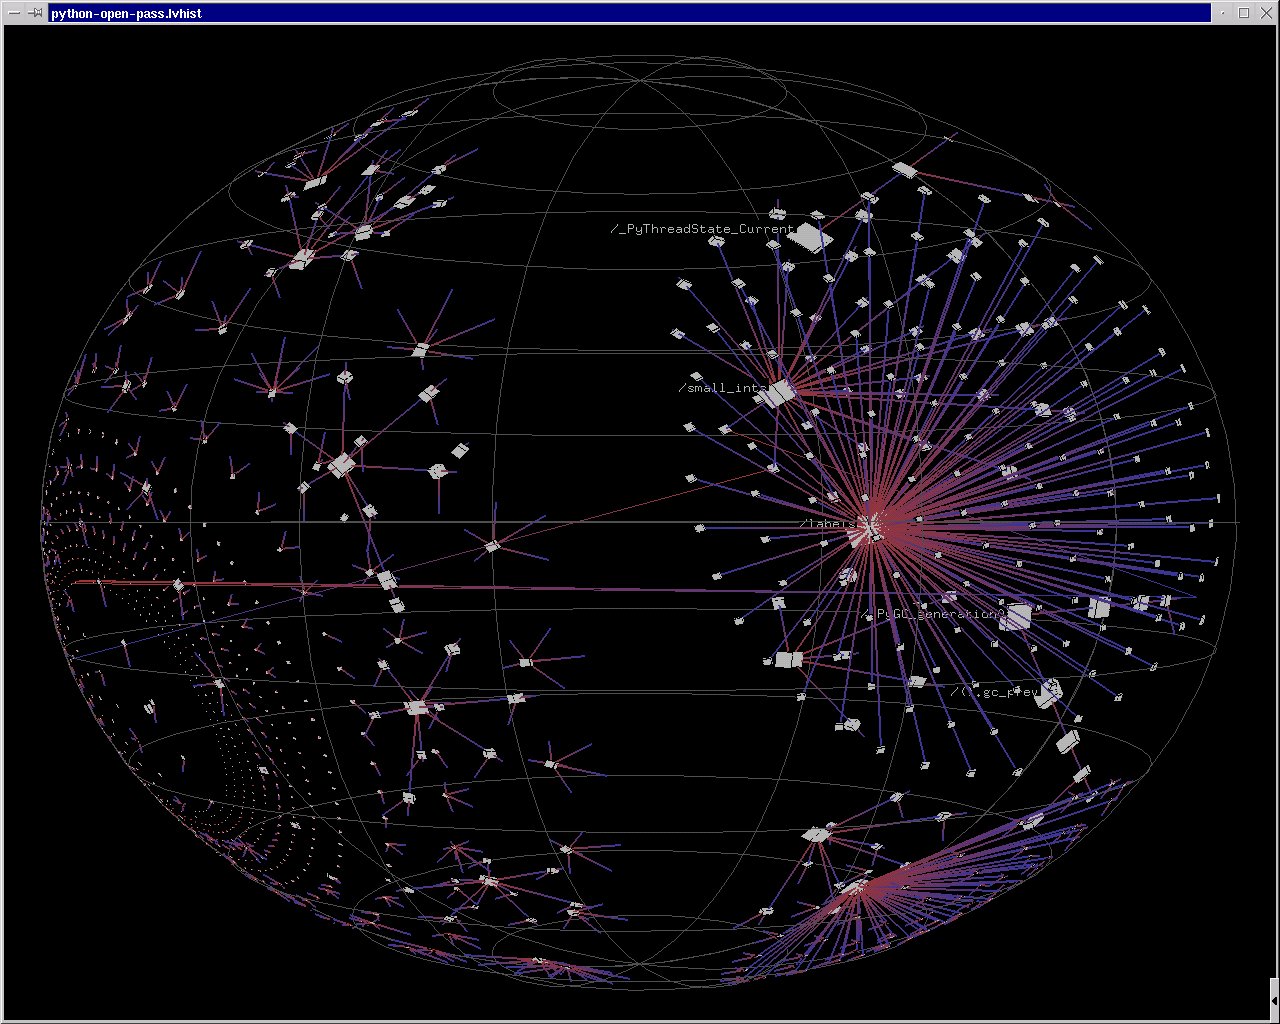
Python
A large memory graph, depicting the state of Python 2.2.
| Graph | Vertices | Edges | Download |
|---|---|---|---|
| Standard | 29912 | 30960 | dot · eps · jpeg · png |
People
Links
- AskIgor automated debugging service
- DDD Debugger
- Software Visualization (in German)
- Java Object Graphs - a similar concept for Java
Software
Contact us
- Your feedback is welcome! Please send all enquiries about Memory Graphs to Andreas Zeller.
Impressum ● Datenschutzerklärung
<webmaster@st.cs.uni-saarland.de> · http://www.st.cs.uni-saarland.de//memgraphs/?lang=de · Stand: 2018-04-05 13:41